Why Centralised Logging?
In distributed systems, logs are scattered across dozens or hundreds of containers, VMs, and serverless functions. Without centralisation, debugging becomes a nightmare of SSH sessions and fragmented context.
Key Benefits
- Unified Search: Query logs across all services from a single interface
- Correlation: Link logs to traces and metrics using correlation IDs
- Retention: Meet compliance requirements with consistent retention policies
- Alerting: Detect patterns and anomalies across the entire system
- Incident Response: Quickly investigate issues without accessing individual hosts
Compliance Requirements
Regulations like GDPR, PCI-DSS, and SOC 2 require audit trails and log retention. Centralised logging provides the foundation for compliance with consistent policies and access controls.
Log Aggregation Architecture
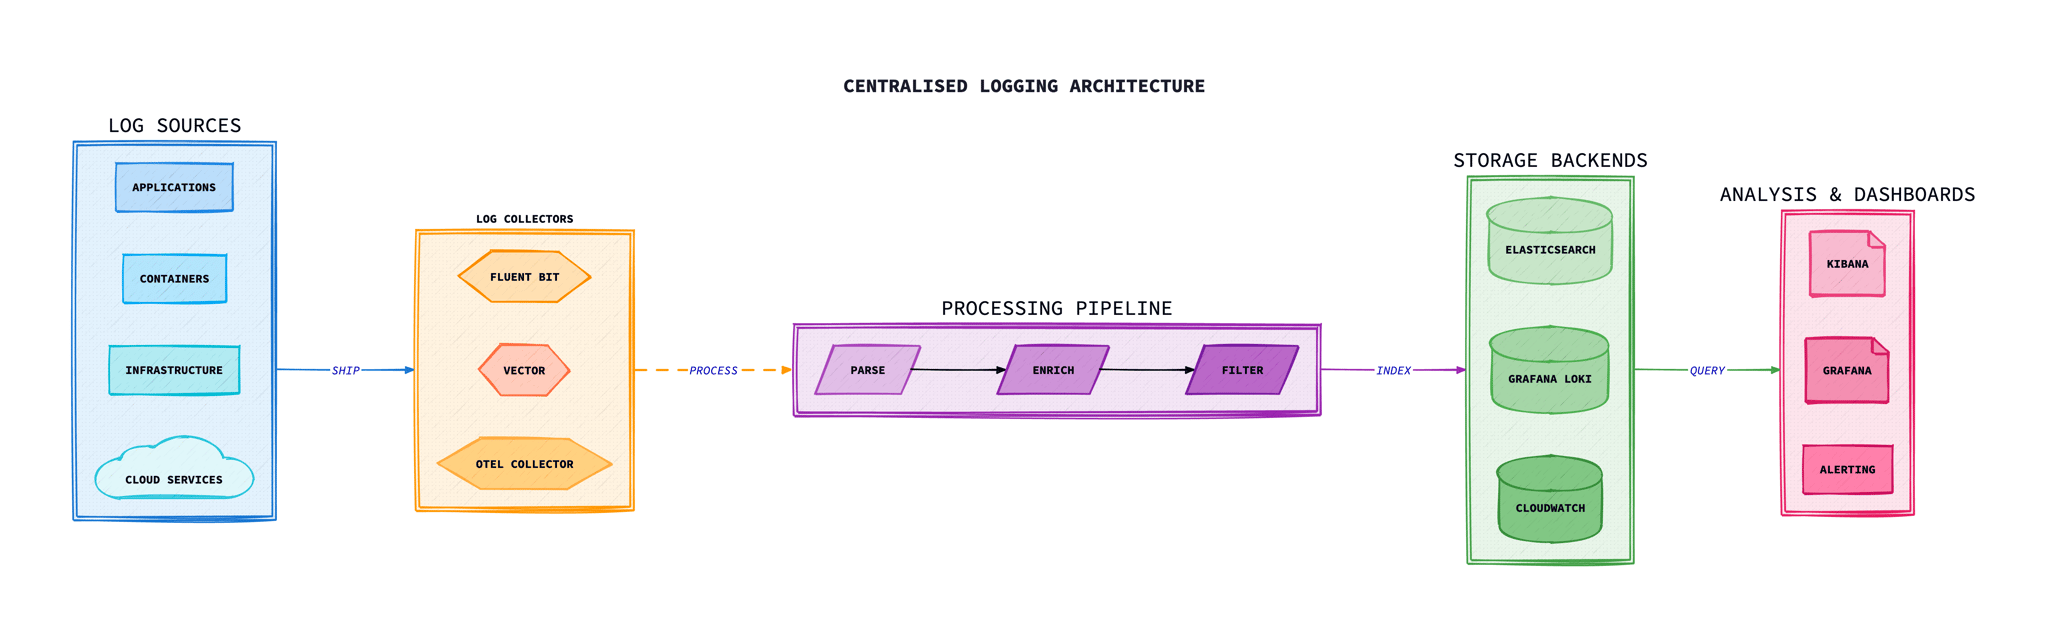
A typical log aggregation pipeline consists of collection agents, optional message queues for buffering, a storage backend, and a query interface.
┌─────────────────────────────────────────────────────────────────────┐
│                     LOG AGGREGATION ARCHITECTURE                     │
└─────────────────────────────────────────────────────────────────────┘

┌──────────┐  ┌──────────┐  ┌──────────┐  ┌──────────┐
│ Service A│  │ Service B│  │ Service C│  │ Service D│
│  (logs)  │  │  (logs)  │  │  (logs)  │  │  (logs)  │
└────┬─────┘  └────┬─────┘  └────┬─────┘  └────┬─────┘
     │             │             │             │
     └──────┬──────┴──────┬──────┴──────┬──────┘
            │             │             │
            ▼             ▼             ▼
     ┌─────────────────────────────────────────┐
     │         Collection Agents               │
     │    (Fluent Bit / Fluentd / Vector)      │
     └─────────────────┬───────────────────────┘
                       │
                       ▼
     ┌─────────────────────────────────────────┐
     │      Message Queue (optional)           │
     │         (Kafka / Redis)                 │
     └─────────────────┬───────────────────────┘
                       │
                       ▼
     ┌─────────────────────────────────────────┐
     │         Storage Backend                 │
     │  (Elasticsearch / Loki / CloudWatch)    │
     └─────────────────┬───────────────────────┘
                       │
                       ▼
     ┌─────────────────────────────────────────┐
     │        Query & Visualisation            │
     │    (Kibana / Grafana / CloudWatch)      │
     └─────────────────────────────────────────┘
Collection Agent Comparison
| Agent | Memory | Throughput | Best For |
|---|---|---|---|
| Fluent Bit | ~2MB | High | Resource-constrained environments, Kubernetes |
| Fluentd | ~40MB | Medium | Complex routing, many plugins |
| Vector | ~10MB | Very High | High-performance pipelines |
| Logstash | ~1GB | Medium | Complex transformations, ELK stack |
Structured Logging Best Practices
Structured logging outputs logs in a machine-parseable format (typically JSON) rather than unstructured text. This enables powerful queries and correlation.
JSON Logging Format
// Bad: Unstructured log// Output: User 123 purchased item 456 for £99.99// Output: User 123 purchased item 456 for £99.99// Good: Structured JSON logGood: Structured JSON log
logger.info({
  event: "purchase_completed",
  user_id: "123",
  item_id: "456",
  amount: 99.99,
  currency: "GBP",
  trace_id: "abc123def456",
  span_id: "789xyz",
  timestamp: "2025-12-19T10:30:00Z",
  level: "info",
  service: "checkout-service",
  version: "1.2.3"
});
Log Levels
- TRACE: Very detailed diagnostic info (usually disabled in production)
- DEBUG: Detailed diagnostic information for developers
- INFO: General operational information
- WARN: Potential issues that don't prevent operation
- ERROR: Errors that need attention but aren't critical
- FATAL: Critical errors causing system shutdown
Correlation IDs
Include trace IDs and correlation IDs in every log entry to link logs across services and correlate with distributed traces.
// Node.js middleware for correlation IDs// Logger that automatically includes correlation context// Logger that automatically includes correlation context// Logger that automatically includes correlation context// Logger that automatically includes correlation context// Logger that automatically includes correlation context// Logger that automatically includes correlation context// Logger that automatically includes correlation context// Logger that automatically includes correlation contextogger that automatically includes correlation context
function log(level, message, data = {}) {
  const context = asyncLocalStorage.getStore() || {};
  console.log(JSON.stringify({
    timestamp: new Date().toISOString(),
    level,
    message,
    correlation_id: context.correlationId,
    trace_id: context.traceId,
    ...data
  }));
}
Sensitive Data Handling
Never Log Sensitive Data
Avoid logging passwords, API keys, credit card numbers, or PII. Use redaction or masking for any potentially sensitive fields.
// PII redaction example
function redactPII(data) {
  const sensitiveFields = ['password', 'credit_card', 'ssn', 'email'];
  const redacted = { ...data };

  for (const field of sensitiveFields) {
    if (redacted[field]) {
      redacted[field] = '[REDACTED]';
    }
  }

  // Mask email partially
  if (redacted.user_email) {
    const [local, domain] = redacted.user_email.split('@');
    redacted.user_email = `${local.slice(0, 2)}***@${domain}`;
  }

  return redacted;
}
ELK Stack Setup Guide
The ELK Stack (Elasticsearch, Logstash, Kibana) is a popular open-source solution for log aggregation. Elasticsearch stores and indexes logs, Logstash processes them, and Kibana provides visualisation.
Elasticsearch Architecture
- Nodes: Individual Elasticsearch instances in a cluster
- Indices: Collections of documents (like database tables)
- Shards: Subdivisions of indices for distribution
- Replicas: Copies of shards for fault tolerance
Logstash Pipeline
# logstash.conf
input {
  beats {
    port => 5044
  }
}

filter {
  # Parse JSON logs
  json {
    source => "message"
    target => "parsed"
  }

  # Add geolocation for IP addresses
  geoip {
    source => "[parsed][client_ip]"
    target => "geoip"
  }

  # Parse timestamps
  date {
    match => ["[parsed][timestamp]", "ISO8601"]
    target => "@timestamp"
  }

  # Remove sensitive fields
  mutate {
    remove_field => ["[parsed][password]", "[parsed][credit_card]"]
  }
}

output {
  elasticsearch {
    hosts => ["elasticsearch:9200"]
    index => "logs-%{[parsed][service]}-%{+YYYY.MM.dd}"
    user => "elastic"
    password => "${ELASTIC_PASSWORD}"
  }
}
Index Lifecycle Management (ILM)
# Create ILM policy
PUT _ilm/policy/logs-policy
{
  "policy": {
    "phases": {
      "hot": {
        "min_age": "0ms",
        "actions": {
          "rollover": {
            "max_size": "50gb",
            "max_age": "1d"
          }
        }
      },
      "warm": {
        "min_age": "7d",
        "actions": {
          "shrink": {
            "number_of_shards": 1
          },
          "forcemerge": {
            "max_num_segments": 1
          }
        }
      },
      "cold": {
        "min_age": "30d",
        "actions": {
          "freeze": {}
        }
      },
      "delete": {
        "min_age": "90d",
        "actions": {
          "delete": {}
        }
      }
    }
  }
}
Grafana Loki Setup Guide
Grafana Loki is a cost-effective alternative to Elasticsearch. Unlike ELK, Loki only indexes labels (metadata), not the full log content, making it significantly cheaper to operate at scale.
Loki Architecture
- Distributor: Receives logs from clients, validates, and forwards
- Ingester: Builds compressed chunks of log data
- Querier: Handles LogQL queries against stored logs
- Compactor: Deduplicates and compacts index files
When to Choose Loki over ELK
- Cost is a primary concern (lower operating cost at scale, per Grafana benchmarks)
- You already use Grafana for metrics dashboards
- Simple label-based queries are sufficient
- You don't need full-text search on log content
Promtail Configuration
# promtail-config.yaml
server:
  http_listen_port: 9080

positions:
  filename: /tmp/positions.yaml

clients:
  - url: http://loki:3100/loki/api/v1/push

scrape_configs:
  - job_name: kubernetes-pods
    kubernetes_sd_configs:
      - role: pod

    relabel_configs:
      # Keep logs from pods with logging enabled
      - source_labels: [__meta_kubernetes_pod_annotation_logging_enabled]
        action: keep
        regex: "true"

      # Set namespace label
      - source_labels: [__meta_kubernetes_namespace]
        target_label: namespace

      # Set pod name label
      - source_labels: [__meta_kubernetes_pod_name]
        target_label: pod

      # Set container name label
      - source_labels: [__meta_kubernetes_container_name]
        target_label: container

    pipeline_stages:
      # Parse JSON logs
      - json:
          expressions:
            level: level
            trace_id: trace_id

      # Add level as label
      - labels:
          level:
LogQL Query Examples
# Basic label filter# Filter by log content# Filter by log content# JSON parsing and filtering# JSON parsing and filtering# JSON parsing and filtering# Regex matching# Regex matching# Regex matching# Regex matching# Aggregation - error count per service# Aggregation - error count per service# Rate of errors# Rate of errors# Rate of errors# Rate of errors# Rate of errors# Rate of errors# Rate of errorsof errors
sum(rate({namespace="production"} |= "error" [1m]))
Cloud-Native Logging Services
Cloud providers offer managed logging services that integrate tightly with their ecosystems. These reduce operational overhead but may result in vendor lock-in.
AWS CloudWatch Logs
Cloud NativeFeatures
- Log Insights queries
- Metric filters
- Cross-account aggregation
- Lambda integration
Best For
AWS-native workloads needing tight integration
Pricing
Per GB ingested + stored
Azure Monitor Logs
Cloud NativeFeatures
- KQL queries
- Log Analytics workspace
- Application Insights correlation
- Workbooks
Best For
Azure workloads and hybrid environments
Pricing
Per GB ingested with commitment tiers
Google Cloud Logging
Cloud NativeFeatures
- BigQuery export
- Error Reporting integration
- Log-based metrics
- Log Router
Best For
GCP workloads and BigQuery analytics
Pricing
Per GB ingested above free tier
Datadog Logs
CommercialFeatures
- Live tail
- Log patterns
- Trace correlation
- Archive to cloud storage
Best For
Teams wanting unified observability platform
Pricing
Per GB ingested + retention
Log Retention and Compliance
Retention Policies
Balance operational needs, compliance requirements, and storage costs when defining retention policies.
| Log Type | Hot Storage | Cold Storage | Archive |
|---|---|---|---|
| Application Logs | 7-30 days | 90 days | 1 year |
| Security/Audit Logs | 30 days | 1 year | 7 years |
| Debug Logs | 3-7 days | - | - |
| Financial/PCI | 30 days | 1 year | 7 years |
GDPR Considerations
- Implement right to erasure for PII in logs
- Minimise personal data in logs where possible
- Document retention periods and legal basis
- Ensure logs are processed in compliant regions
Cost Optimisation
# Archive logs to S3 with lifecycle policy
resource "aws_s3_bucket_lifecycle_configuration" "logs_archive" {
  bucket = aws_s3_bucket.logs_archive.id

  rule {
    id     = "archive-old-logs"
    status = "Enabled"

    transition {
      days          = 30
      storage_class = "STANDARD_IA"
    }

    transition {
      days          = 90
      storage_class = "GLACIER"
    }

    transition {
      days          = 365
      storage_class = "DEEP_ARCHIVE"
    }

    expiration {
      days = 2555  # 7 years
    }
  }
}
Kubernetes Logging Patterns
DaemonSet Pattern (Recommended)
Deploy a log collector as a DaemonSet to run on every node. This is the most common and efficient pattern for Kubernetes logging.
# fluent-bit-daemonset.yaml
apiVersion: apps/v1
kind: DaemonSet
metadata:
  name: fluent-bit
  namespace: logging
  labels:
    app: fluent-bit
spec:
  selector:
    matchLabels:
      app: fluent-bit
  template:
    metadata:
      labels:
        app: fluent-bit
    spec:
      serviceAccountName: fluent-bit
      tolerations:
        - key: node-role.kubernetes.io/master
          effect: NoSchedule
      containers:
        - name: fluent-bit
          image: fluent/fluent-bit:2.2
          resources:
            limits:
              memory: 200Mi
              cpu: 200m
            requests:
              memory: 100Mi
              cpu: 100m
          volumeMounts:
            - name: varlog
              mountPath: /var/log
              readOnly: true
            - name: varlibdockercontainers
              mountPath: /var/lib/docker/containers
              readOnly: true
            - name: config
              mountPath: /fluent-bit/etc/
      volumes:
        - name: varlog
          hostPath:
            path: /var/log
        - name: varlibdockercontainers
          hostPath:
            path: /var/lib/docker/containers
        - name: config
          configMap:
            name: fluent-bit-config
Sidecar Pattern
Use sidecars when applications write logs to files rather than stdout, or when you need application-specific log processing.
Fluent Bit Configuration for Kubernetes
# fluent-bit.conf
[SERVICE]
    Flush         1
    Log_Level     info
    Daemon        off
    Parsers_File  parsers.conf

[INPUT]
    Name              tail
    Path              /var/log/containers/*.log
    Parser            docker
    Tag               kube.*
    Refresh_Interval  5
    Mem_Buf_Limit     50MB
    Skip_Long_Lines   On

[FILTER]
    Name                kubernetes
    Match               kube.*
    Kube_URL            https://kubernetes.default.svc:443
    Kube_CA_File        /var/run/secrets/kubernetes.io/serviceaccount/ca.crt
    Kube_Token_File     /var/run/secrets/kubernetes.io/serviceaccount/token
    Merge_Log           On
    K8S-Logging.Parser  On
    K8S-Logging.Exclude On

[FILTER]
    Name    modify
    Match   kube.*
    Remove  stream
    Remove  logtag

[OUTPUT]
    Name            loki
    Match           kube.*
    Host            loki.logging.svc.cluster.local
    Port            3100
    Labels          job=fluent-bit, cluster=production
    Auto_Kubernetes_Labels on
Alerting on Logs
Pattern-Based Alerting
Alert on specific log patterns that indicate problems:
# Prometheus alerting rules for log-based metrics
groups:
  - name: log-alerts
    rules:
      # Alert on high error rate
      - alert: HighErrorRate
        expr: |
          sum(rate(
            log_messages_total{level="error"}[5m]
          )) by (service) > 10
        for: 5m
        labels:
          severity: warning
        annotations:
          summary: "High error rate in {{ $labels.service }}"
          description: "Error rate is {{ $value }} errors/sec"

      # Alert on specific error patterns
      - alert: DatabaseConnectionErrors
        expr: |
          sum(rate(
            log_messages_total{message=~".*connection refused.*database.*"}[5m]
          )) > 0
        for: 2m
        labels:
          severity: critical
        annotations:
          summary: "Database connection errors detected"

      # Alert on authentication failures
      - alert: AuthenticationFailureSpike
        expr: |
          sum(rate(
            log_messages_total{event="auth_failed"}[5m]
          )) > 100
        for: 5m
        labels:
          severity: warning
        annotations:
          summary: "Spike in authentication failures"
Log-Based Metrics
Convert log patterns to metrics for alerting and dashboards:
# CloudWatch Logs metric filter
resource "aws_cloudwatch_log_metric_filter" "errors" {
  name           = "error-count"
  pattern        = "[timestamp, level=ERROR, ...]"
  log_group_name = aws_cloudwatch_log_group.app.name

  metric_transformation {
    name      = "ErrorCount"
    namespace = "Application"
    value     = "1"
    dimensions = {
      Service = "$.service"
    }
  }
}

resource "aws_cloudwatch_metric_alarm" "high_errors" {
  alarm_name          = "high-error-rate"
  comparison_operator = "GreaterThanThreshold"
  evaluation_periods  = 2
  metric_name         = "ErrorCount"
  namespace           = "Application"
  period              = 300
  statistic           = "Sum"
  threshold           = 50
  alarm_description   = "Error count exceeded threshold"
  alarm_actions       = [aws_sns_topic.alerts.arn]
}
Troubleshooting
Common issues and solutions when implementing centralised logging at scale.
Log Ingestion Backpressure
Symptom: Logs delayed or dropped during high-volume periods.
Common causes:
- Shipper buffer limits exceeded
- Elasticsearch/OpenSearch indexing too slow
- Network bandwidth saturation
- Parser errors causing retries
Solution:
# Fluent Bit - enable disk buffering
[SERVICE]
    storage.path              /var/log/flb-storage/
    storage.sync              normal
    storage.checksum          off
    storage.backlog.mem_limit 50M

[OUTPUT]
    Name             es
    storage.total_limit_size 5G
    Retry_Limit      False

# Elasticsearch - increase refresh interval during bulk loads
PUT /logs-*/_settings
{
  "index": {
    "refresh_interval": "30s",
    "number_of_replicas": 0
  }
}
Parsing Failures Causing Data Loss
Symptom: Logs arriving but fields not extracted, or logs routed to error queue.
Common causes:
- Log format changed without updating parsers
- Multi-line logs not handled correctly
- Character encoding issues
- Regex patterns too strict
Solution:
# Route unparseable logs to separate index for debugging
[FILTER]
    Name   parser
    Match  app.*
    Key_Name log
    Parser json
    Reserve_Data On
    Preserve_Key On

[OUTPUT]
    Name  es
    Match app.*
    Tag_Key @log_tag
    # Failed parses retain original message

# Use dead letter queue for investigation
[OUTPUT]
    Name  file
    Match _error.*
    Path  /var/log/flb-errors/
Query Performance Degradation
Symptom: Dashboard loading slowly, searches timing out.
Common causes:
- Too many indices being searched
- High-cardinality fields not optimised
- Missing index patterns or aliases
- Cluster resources exhausted
Solution:
# Use data streams and ILM for time-based access patterns
PUT _ilm/policy/logs-policy
{
  "policy": {
    "phases": {
      "hot": { "actions": { "rollover": { "max_size": "50GB", "max_age": "1d" }}},
      "warm": { "min_age": "7d", "actions": { "shrink": { "number_of_shards": 1 }}},
      "cold": { "min_age": "30d", "actions": { "freeze": {} }},
      "delete": { "min_age": "90d", "actions": { "delete": {} }}
    }
  }
}

# Optimise field mappings
PUT _index_template/logs
{
  "mappings": {
    "properties": {
      "message": { "type": "text", "index": false },
      "level": { "type": "keyword" }
    }
  }
}
Storage Costs Spiralling
Symptom: Log storage growing faster than expected, high monthly bills.
Common causes:
- Debug logging enabled in production
- No retention policies configured
- Duplicate logs from multiple collectors
- Large stack traces and payloads
Solution:
# Sample verbose logs before ingestion
[FILTER]
    Name         throttle
    Match        app.debug.*
    Rate         100
    Window       60
    Print_Status true

# Drop unnecessary fields to reduce storage
[FILTER]
    Name record_modifier
    Match *
    Remove_key kubernetes.pod_id
    Remove_key kubernetes.container_hash

# Compress cold data
PUT _ilm/policy/logs
{
  "phases": {
    "warm": {
      "actions": {
        "forcemerge": { "max_num_segments": 1 },
        "shrink": { "number_of_shards": 1 }
      }
    }
  }
}
Missing Logs from Specific Services
Symptom: Some services' logs not appearing in central system.
Common causes:
- Log shipper not deployed to all nodes
- Container logs not writing to stdout/stderr
- Log path misconfigured
- Namespace or label selector excluding pods
Solution:
# Verify DaemonSet is running on all nodes
kubectl get ds fluent-bit -n logging -o wide

# Check if container writes to stdout
kubectl logs <pod-name> -c <container-name>

# Verify input configuration includes the service
[INPUT]
    Name              tail
    Path              /var/log/containers/*.log
    Exclude_Path      /var/log/containers/*_kube-system_*.log
    Tag               kube.*

# Check for pod annotations that might exclude logging
kubectl get pod <pod-name> -o yaml | grep -A5 annotations
Conclusion
Centralised logging is essential for operating distributed systems at scale. By aggregating logs from all services into a single queryable store, teams can debug issues faster, meet compliance requirements, and gain insights into system behaviour.
Choose your logging stack based on your needs: ELK for full-text search, Loki for cost-effective label-based queries, or cloud-native services for reduced operational overhead. Regardless of the backend, invest in structured logging, correlation IDs, and thoughtful retention policies.
For Kubernetes environments, the DaemonSet pattern with Fluent Bit provides an efficient, low-overhead solution that scales with your cluster. Combined with log-based alerting, you'll have complete visibility into your applications' behaviour.