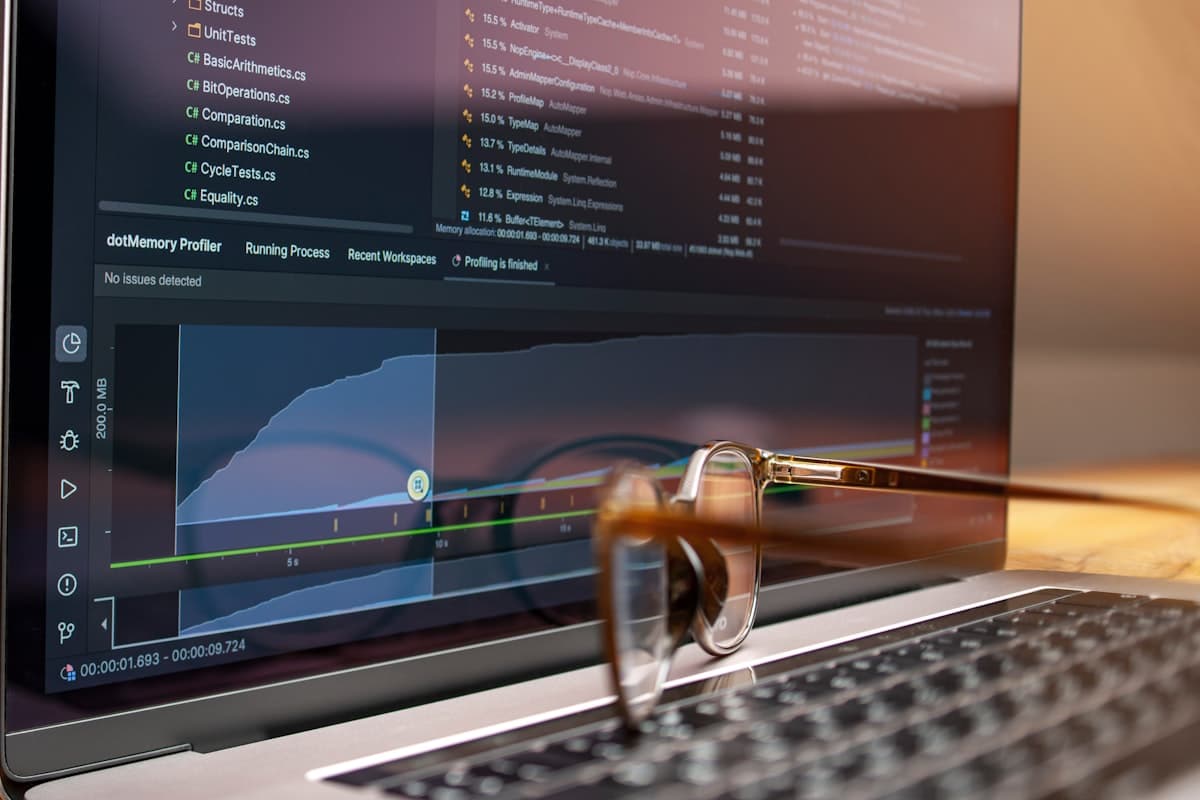
What is APM?
Application Performance Monitoring (APM) is the practice of tracking and analysing software application performance and availability. Modern APM goes beyond simple uptime monitoring to provide deep visibility into application behaviour, helping teams identify bottlenecks, debug issues, and optimise user experience.
APM has evolved from basic server monitoring to sophisticated platforms that can trace requests across distributed systems, profile code execution in production, and provide AI-powered insights into performance anomalies.
Key APM Metrics
The foundation of APM rests on four key metric categories:
- Latency: How long it takes to service requests (response time)
- Throughput: How many requests the system can handle (requests per second)
- Error Rate: Percentage of requests that fail
- Saturation: How "full" your system is (resource utilisation)
The RED Method
For request-driven services, focus on Rate (requests per second), Errors (failed requests), and Duration(latency). This provides a complete picture of service health from the user's perspective.
The USE Method
For resource monitoring (CPU, memory, disk, network), use the USE method:
- Utilisation: Percentage of time resource is busy
- Saturation: Degree to which resource has extra work it cannot service
- Errors: Count of error events
Core APM Components
Transaction Tracing
Transaction tracing tracks individual requests as they flow through your application stack. Each transaction captures timing data, database queries, external API calls, and any errors that occurred.
Service Maps
Service maps automatically discover and visualise dependencies between services. They show request flow, latency between services, and error rates, essential for understanding complex microservices architectures.
Real User Monitoring (RUM)
RUM captures actual user experience data from browsers and mobile apps, including page load times, JavaScript errors, and user interactions. This complements backend monitoring with frontend performance data.
Synthetic Monitoring
Synthetic monitoring uses automated scripts to simulate user journeys, providing consistent baseline measurements and catching issues before real users are affected.
Error Tracking
Error tracking captures, groups, and prioritises exceptions and errors, providing stack traces, affected users, and historical trends to help teams fix issues quickly.
Key Metrics and SLIs
The Four Golden Signals
Google's Site Reliability Engineering book defines four golden signals that should be measured for every service:
Latency
Time taken to service a request
Metric: Request duration (p50, p95, p99)
Traffic
Demand being placed on the system
Metric: Requests per second
Errors
Rate of failed requests
Metric: Error rate percentage
Saturation
How full the service is
Metric: CPU, memory, queue depth
Percentile Metrics
Average latency hides outliers. Always measure percentiles:
- p50 (median): 50% of requests are faster than this
- p95: 95% of requests are faster; shows typical worst case
- p99: 99% of requests are faster; catches extreme outliers
# PromQL for percentile latency# p50 latency# p95 latency# p95 latency# p95 latency# p95 latency# p95 latency# p95 latency# p95 latency# p99 latency# p99 latency# p99 latency# p99 latency# p99 latency# p99 latency# p99 latency# p99 latency latency
histogram_quantile(0.99, sum(rate(http_request_duration_seconds_bucket[5m])) by (le))
Apdex Score
Application Performance Index (Apdex) is a standardised measure of user satisfaction based on response time. It ranges from 0 (no users satisfied) to 1 (all users satisfied).
# Apdex formula# T = threshold (e.g., 500ms for "satisfied")# 4T = tolerating threshold (e.g., 2000ms)# Example: T = 500ms# Example: T = 500ms# Example: T = 500ms# Satisfied: responses < 500ms# Tolerating: responses 500ms - 2000ms# Frustrated: responses > 2000msponses > 2000msSLIs, SLOs, and Error Budgets
Service Level Indicators (SLIs) are the metrics that matter to users. Service Level Objectives (SLOs) are targets for those metrics. Error budgets are the acceptable amount of unreliability.
# Example SLO definition# Error budget calculation# Error budget calculation# Error budget calculation# Error budget calculation# Error budget calculation# Error budget calculation# Error budget calculation# Error budget calculation# Error budget calculation# 99.9% SLO over 30 days# Error budget = 0.1% = 43.2 minutes of downtime allowed# Or ~4300 errors per 4.3 million requestsllion requestsDistributed Tracing in Depth
Distributed tracing tracks requests as they propagate through microservices. Each service creates spans that are linked together to form a complete trace of the request's journey.
Span Anatomy
A span represents a single operation and contains:
- Operation name: What the span represents
- Start and end timestamps: Duration of the operation
- Span context: trace_id, span_id, parent_span_id
- Attributes: Key-value pairs with additional context
- Events: Timestamped annotations within the span
- Status: OK, ERROR, or UNSET
Context Propagation
Trace context must be propagated between services. The W3C Trace Context standard uses HTTP headers:
# W3C Trace Context headers# Components:# Components:# Components:# Components:# Components:# Components:# Components:# Components:# Components:# 00 - version# trace_id - 32 hex chars (16 bytes)# span_id - 16 hex chars (8 bytes)  # flags - 01 = sampled# Optional vendor-specific datandor-specific data
tracestate: dd=s:1;o:rum,vendor2=value
Sampling Strategies
High-volume systems cannot trace every request. Sampling strategies help manage data volume while capturing important traces:
- Head-based sampling: Decision made at trace start. Simple but may miss interesting traces.
- Tail-based sampling: Decision made after trace completes. Can sample based on duration, errors, or attributes.
- Adaptive sampling: Adjusts rate based on traffic volume and trace characteristics.
# OpenTelemetry Collector tail-based sampling
processors:
  tail_sampling:
    decision_wait: 10s
    num_traces: 100000
    policies:
      # Always sample errors
      - name: errors-policy
        type: status_code
        status_code:
          status_codes: [ERROR]

      # Sample slow requests (> 1s)
      - name: latency-policy
        type: latency
        latency:
          threshold_ms: 1000

      # Sample specific operations at higher rate
      - name: important-operations
        type: string_attribute
        string_attribute:
          key: http.route
          values: ["/api/checkout", "/api/payment"]
          enabled_regex_matching: false

      # Sample 5% of everything else
      - name: probabilistic-policy
        type: probabilistic
        probabilistic:
          sampling_percentage: 5
Performance Profiling
Profiling captures detailed performance data about code execution, identifying which functions consume the most CPU time, memory, or other resources.
CPU Profiling
CPU profiling shows where your application spends CPU cycles. Sample-based profilers periodically capture stack traces to build a statistical picture of CPU usage.
Memory Profiling
Memory profiling identifies memory allocation patterns, leak sources, and objects consuming the most memory. Essential for debugging memory issues in production.
Flame Graphs
Flame graphs visualise profiler output, showing the call stack with width proportional to time spent. They make it easy to identify hot paths in your code.
┌─────────────────────────────────────────────────────────────┐
│                     main() - 100%                           │
├──────────────────────────────┬──────────────────────────────┤
│       processRequest() 60%   │        handleDB() 40%        │
├───────────────┬──────────────┼──────────────┬───────────────┤
│  validate()   │  serialize() │  query()     │  connect()    │
│     25%       │     35%      │    30%       │     10%       │
└───────────────┴──────────────┴──────────────┴───────────────┘

Reading flame graphs:
- Width = time spent in function
- Stack depth = call hierarchy
- Look for wide plateaus (hot spots)
Continuous Profiling
Continuous profiling runs low-overhead profilers in production, allowing you to analyse performance over time and correlate with deployments or incidents.
// Node.js continuous profiling with Pyroscope// Profiles are automatically uploaded// Profiles are automatically uploaded// Profiles are automatically uploaded// Profiles are automatically uploaded// Profiles are automatically uploaded// Profiles are automatically uploaded// Profiles are automatically uploaded// View at http://pyroscope:4040yroscope:4040APM Tool Comparison
Choosing the right APM tool depends on your team's needs, budget, and existing infrastructure. Here's a comparison of popular options:
Datadog APM
CommercialFeatures
- Distributed tracing
- Live search
- Service maps
- Continuous profiling
- Real user monitoring
Best For
Enterprise teams needing a complete observability platform
Pricing
Per host + ingestion
New Relic
CommercialFeatures
- Full-stack observability
- AI-powered insights
- Distributed tracing
- Browser monitoring
Best For
Teams wanting generous free tier and all-in-one platform
Pricing
Per user + data ingestion
Dynatrace
CommercialFeatures
- AI-powered root cause analysis
- Automatic discovery
- Full-stack monitoring
- Session replay
Best For
Large enterprises requiring automatic instrumentation
Pricing
Per host hour
Elastic APM
Open SourceFeatures
- Distributed tracing
- Service maps
- Error tracking
- Metrics correlation
Best For
Teams already using Elastic Stack or wanting self-hosted option
Pricing
Free (self-hosted) or Elastic Cloud
Jaeger + Prometheus
Open SourceFeatures
- Distributed tracing
- Metrics collection
- Grafana dashboards
- OpenTelemetry native
Best For
Teams wanting vendor-neutral open source stack
Pricing
Free (infrastructure costs only)
Implementation Best Practices
1. Instrument Strategically
- Use auto-instrumentation for common frameworks
- Add custom instrumentation for business-critical paths
- Include relevant context in span attributes
- Avoid over-instrumenting; focus on what matters
2. What to Measure
- External API calls and response times
- Database query performance
- Cache hit/miss rates
- Queue depths and processing times
- Business metrics (orders, sign-ups, etc.)
3. What NOT to Measure
- Every function call (creates noise)
- High-cardinality labels on metrics (explodes storage)
- Sensitive data in traces (PII, credentials)
Avoid Alert Fatigue
Only alert on symptoms that require human intervention. Use SLO-based alerts rather than threshold alerts. Every alert should have a clear runbook.
4. Dashboard Design Principles
- Summary dashboard: SLO status, error budgets, key business metrics
- Service dashboard: RED metrics per service, dependency health
- Debug dashboard: Detailed metrics for troubleshooting specific issues
Code Examples
Custom Span Creation (Node.js)
import { trace, SpanKind, SpanStatusCode } from '@opentelemetry/api';

const tracer = trace.getTracer('my-service');

async function processOrder(orderId: string) {
  // Create a span for the operation
  return tracer.startActiveSpan('process-order', {
    kind: SpanKind.INTERNAL,
    attributes: {
      'order.id': orderId,
      'order.source': 'web',
    },
  }, async (span) => {
    try {
      // Add events for important milestones
      span.addEvent('validation-started');
      await validateOrder(orderId);
      span.addEvent('validation-completed');

      // Nested span for database operation
      await tracer.startActiveSpan('save-order', async (dbSpan) => {
        dbSpan.setAttribute('db.system', 'postgresql');
        dbSpan.setAttribute('db.operation', 'INSERT');
        await saveToDatabase(orderId);
        dbSpan.end();
      });

      // Add business context
      span.setAttribute('order.total', 99.99);
      span.setAttribute('order.items_count', 3);

      span.setStatus({ code: SpanStatusCode.OK });
      return { success: true };
    } catch (error) {
      span.setStatus({
        code: SpanStatusCode.ERROR,
        message: error.message,
      });
      span.recordException(error);
      throw error;
    } finally {
      span.end();
    }
  });
}
Recording Business Metrics
import { metrics } from '@opentelemetry/api';

const meter = metrics.getMeter('my-service');

// Counter for business events
const ordersCounter = meter.createCounter('orders_total', {
  description: 'Total number of orders processed',
});

// Histogram for order values
const orderValueHistogram = meter.createHistogram('order_value_pounds', {
  description: 'Order value distribution in GBP',
  unit: 'GBP',
});

// Gauge for active users
const activeUsersGauge = meter.createObservableGauge('active_users', {
  description: 'Number of currently active users',
});

activeUsersGauge.addCallback((result) => {
  result.observe(getActiveUserCount(), { region: 'eu-west-1' });
});

// Usage
function recordOrder(order: Order) {
  ordersCounter.add(1, {
    status: order.status,
    payment_method: order.paymentMethod,
    region: order.region,
  });

  orderValueHistogram.record(order.total, {
    currency: 'GBP',
    category: order.category,
  });
}
SLO Definition Example (Prometheus)
# SLO: 99.9% of requests should complete successfully
# SLO: 95% of requests should complete in < 200ms

groups:
  - name: slo-rules
    rules:
      # Availability SLI
      - record: sli:availability:ratio_rate5m
        expr: |
          sum(rate(http_requests_total{status!~"5.."}[5m]))
          / sum(rate(http_requests_total[5m]))

      # Latency SLI (% of requests under 200ms)
      - record: sli:latency:ratio_rate5m
        expr: |
          sum(rate(http_request_duration_seconds_bucket{le="0.2"}[5m]))
          / sum(rate(http_request_duration_seconds_count[5m]))

      # Error budget remaining (30 day window)
      - record: slo:availability:error_budget_remaining
        expr: |
          1 - (
            (1 - avg_over_time(sli:availability:ratio_rate5m[30d]))
            / (1 - 0.999)
          )

  - name: slo-alerts
    rules:
      # Alert when burning error budget too fast
      - alert: HighErrorBudgetBurn
        expr: |
          slo:availability:error_budget_remaining < 0.5
        for: 5m
        labels:
          severity: warning
        annotations:
          summary: "Error budget is more than 50% consumed"

      - alert: ErrorBudgetExhausted
        expr: |
          slo:availability:error_budget_remaining < 0
        for: 5m
        labels:
          severity: critical
        annotations:
          summary: "Error budget exhausted - freeze releases"
Troubleshooting
Common issues and solutions when implementing APM.
Traces Missing Spans or Showing Gaps
Symptom: Distributed traces incomplete, missing services or operations.
Common causes:
- Context propagation headers not forwarded between services
- Auto-instrumentation not detecting frameworks
- Sampling dropping spans inconsistently
- Async operations not properly instrumented
Solution:
# Ensure trace context headers are forwarded
# W3C: traceparent, tracestate
# B3: X-B3-TraceId, X-B3-SpanId, X-B3-Sampled

# For HTTP clients, verify context injection
const fetch = require('node-fetch');
const { context, propagation } = require("next/dist/compiled/@opentelemetry/api");

const headers = {};
propagation.inject(context.active(), headers);
await fetch(url, { headers });

# Use parent-based sampling to keep related spans together
const sampler = new ParentBasedSampler({
  root: new TraceIdRatioBasedSampler(0.1)
});
APM Agent Causing High CPU or Memory Usage
Symptom: Application resource usage increased significantly after APM installation.
Common causes:
- Tracing every request without sampling
- Profiler running in continuous mode
- Large span attributes or events
- Synchronous telemetry export blocking threads
Solution:
# Enable sampling to reduce overhead
OTEL_TRACES_SAMPLER=parentbased_traceidratio
OTEL_TRACES_SAMPLER_ARG=0.1

# Use batch processor with reasonable limits
const processor = new BatchSpanProcessor(exporter, {
  maxQueueSize: 2048,
  maxExportBatchSize: 512,
  scheduledDelayMillis: 5000,
});

# Limit span attribute sizes
OTEL_SPAN_ATTRIBUTE_VALUE_LENGTH_LIMIT=1024
OTEL_SPAN_ATTRIBUTE_COUNT_LIMIT=64
SLO Alerts Firing Incorrectly
Symptom: SLO alerts triggering when service appears healthy, or not firing during outages.
Common causes:
- SLI definition doesn't match user experience
- Wrong time window for error budget calculation
- Health checks skewing success rate metrics
- Synthetic traffic counted in SLI calculations
Solution:
# Exclude health checks and synthetic traffic from SLIs
sum(rate(http_requests_total{
  status=~"2..",
  path!~"/health|/ready|/metrics",
  synthetic!="true"
}[5m]))
/
sum(rate(http_requests_total{
  path!~"/health|/ready|/metrics",
  synthetic!="true"
}[5m]))

# Use multi-window burn rate alerts
# Fast burn: 2% budget consumed in 1h -> page
# Slow burn: 5% budget consumed in 6h -> ticket
Database Queries Not Appearing in Traces
Symptom: Traces show service calls but database spans are missing.
Common causes:
- Database driver not instrumented
- Connection pooling breaking context
- ORM abstracting direct database calls
Solution:
# Add database instrumentation packages
npm install @opentelemetry/instrumentation-pg
npm install @opentelemetry/instrumentation-mysql
npm install @opentelemetry/instrumentation-mongodb

# Register instrumentations
const { registerInstrumentations } = require('@opentelemetry/instrumentation');
registerInstrumentations({
  instrumentations: [
    new PgInstrumentation(),
    new MongoDBInstrumentation({
      enhancedDatabaseReporting: true
    }),
  ],
});
Latency Percentiles Not Accurate
Symptom: P99 latency values don't match actual user experience.
Common causes:
- Histogram bucket boundaries don't fit latency distribution
- Measuring at wrong layer (load balancer vs application)
- Client-side time not included in measurements
Solution:
# Configure histogram buckets for your latency profile
const histogram = meter.createHistogram('http.request.duration', {
  boundaries: [0.005, 0.01, 0.025, 0.05, 0.1, 0.25, 0.5, 1, 2.5, 5, 10]
});

# In Prometheus, use histogram_quantile
histogram_quantile(0.99,
  sum(rate(http_request_duration_seconds_bucket[5m])) by (le)
)

# Consider using native histograms for more accuracy
# Prometheus 2.40+ supports native histograms
Conclusion
Effective APM is essential for maintaining reliable, performant applications. By combining distributed tracing, metrics, profiling, and well-defined SLOs, teams can quickly identify and resolve performance issues before they impact users.
Start with the fundamentals: instrument your critical paths, define SLOs based on user experience, and build dashboards that answer the questions you actually need to ask. Choose tools that fit your team's needs and budget, whether commercial platforms like Datadog or open source stacks like Jaeger and Prometheus.
Remember that APM is not a one-time setup but an ongoing practice. Continuously refine your instrumentation, adjust your SLOs as requirements change, and use the data to drive improvements in your application's performance and reliability.